Fig. 3
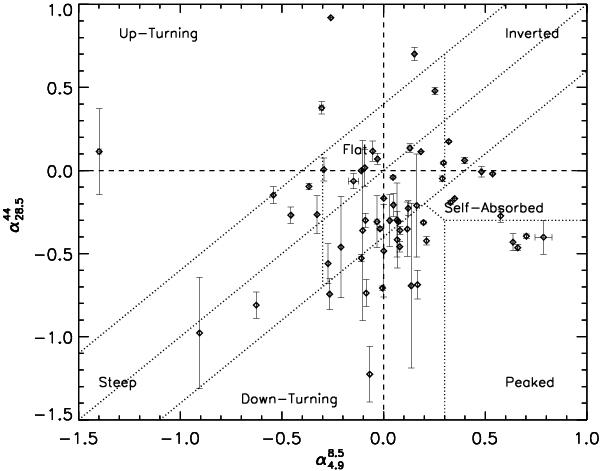
5–40 GHz radio source color–color diagnostic plot. Note that here we extrapolate both the VLA K-band and the JVLA Ka-band observations to 28.46 GHz, the center frequency of the Planck 30 GHz band. All observations for a given source are averaged, such that each data point represents a unique source. For ease of comparison, we adopt the Massardi et al. (2011) definitions of “flat”, “steep”, “up-turning”, “inverted”, “self-absorbed” and “peaked” spectra (as defined by the dotted regions).
Current usage metrics show cumulative count of Article Views (full-text article views including HTML views, PDF and ePub downloads, according to the available data) and Abstracts Views on Vision4Press platform.
Data correspond to usage on the plateform after 2015. The current usage metrics is available 48-96 hours after online publication and is updated daily on week days.
Initial download of the metrics may take a while.