Fig. 9
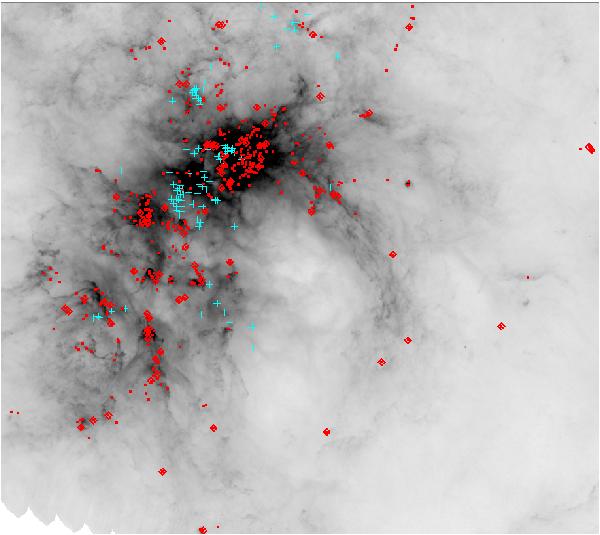
Herschel PACS 70 μm image of the CNC with square root intensity scale. The positions of the OB stars from Smith (2006) are marked with cyan crosses. Positions of the Herschel point-like sources are marked with red squares. The positions of all 80 YSOs with SED fits are marked with red diamonds. Note that their distribution is concentrated on the cloud edges.
Current usage metrics show cumulative count of Article Views (full-text article views including HTML views, PDF and ePub downloads, according to the available data) and Abstracts Views on Vision4Press platform.
Data correspond to usage on the plateform after 2015. The current usage metrics is available 48-96 hours after online publication and is updated daily on week days.
Initial download of the metrics may take a while.