Fig. 8
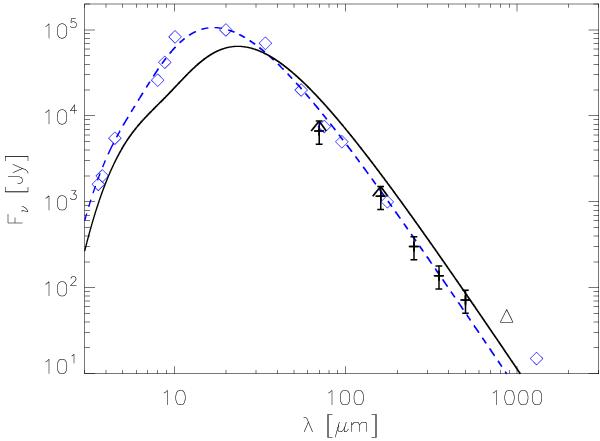
Spectral energy distribution of η Carinae. The black crosses show our Herschel fluxes. The 70 μm and 160 μm PACS fluxes represent upper limits. The black triangle shows our LABOCA 870 μm flux determined in Preibisch et al. (2011c). The blue diamonds are the data from Cox et al. (1995). The dashed line represents the sum of two modified Planck spectra for dust temperatures of 210 K and 430 K from the model of Cox et al. (1995), the solid line the sum of three Planck spectra for dust temperatures of 140 K, 200 K, and 400 K from the model of Smith et al. (2003). We note that for wavelengths above ≥ 500 μm the SED gets dominated by free-free emission of the Homunculus nebula and the radiation originating in the ionized stellar wind of η Car.
Current usage metrics show cumulative count of Article Views (full-text article views including HTML views, PDF and ePub downloads, according to the available data) and Abstracts Views on Vision4Press platform.
Data correspond to usage on the plateform after 2015. The current usage metrics is available 48-96 hours after online publication and is updated daily on week days.
Initial download of the metrics may take a while.