Fig. 7
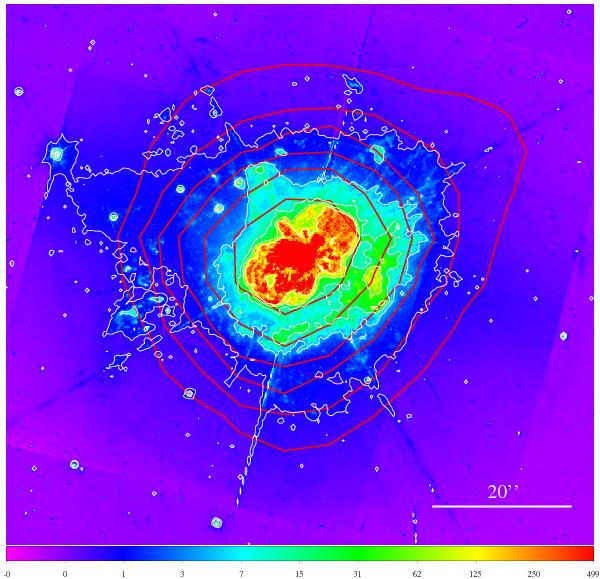
HST/WFPC2 image (data set hst_9226_01_wfpc2_f658n_wf) of η Carinae obtained through the narrow-band filter F658N. The image is displayed with a logarithmic intensity scale in order to show the rather faint nebular features of the outer ejecta. The thin white contour lines also highlight the structure of the optical nebula. The thick red contours trace the Herschel 70 μm band emission. The contour levels start at 3.125 Jy/pixel and increase by a factor of 2 up to the 200 Jy/pixel level.
Current usage metrics show cumulative count of Article Views (full-text article views including HTML views, PDF and ePub downloads, according to the available data) and Abstracts Views on Vision4Press platform.
Data correspond to usage on the plateform after 2015. The current usage metrics is available 48-96 hours after online publication and is updated daily on week days.
Initial download of the metrics may take a while.