Fig. 6
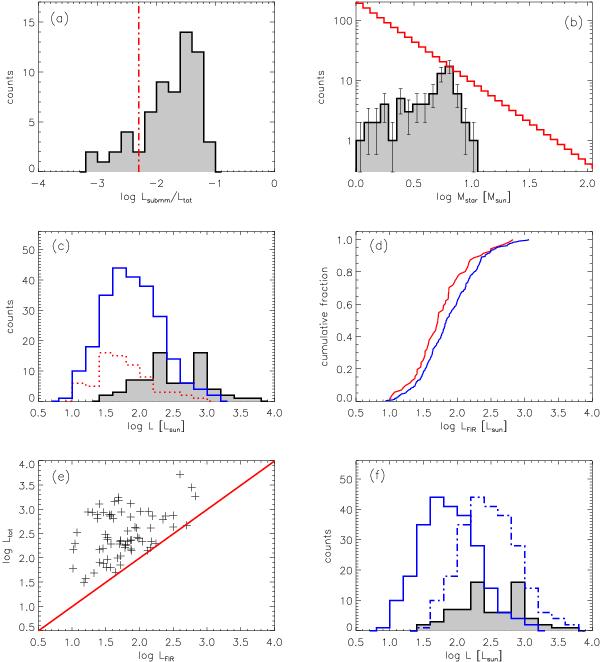
Total luminosities and central stellar mass of the Herschel YSOs. Top panels: a) ratio of the sub-mm luminosity (integrated SED for λ ≥ 350 μm) and the total luminosity obtained from the Robitaille models for all sources with an acceptable SED fit. The vertical dash-dotted red line marks the transition between Class 0 (Lsubmm/Ltot ≥ 0.005) and Class I objects (see Andre et al. 1993). b) Histogram of the stellar mass. The solid red line shows the IMF with a slope of γ = −1.35. Middle panels: c) histogram of the total luminosity obtained from the Robitaille models for sources with an acceptable SED fit (gray histogram). Overploted are the integrated far-infrared luminosity Lint,FIR of all sources with an acceptable SED fit (dotted red histogram), and the integrated far-infrared luminosity of all Herschel point-like sources in the CNC with fluxes detected in minimum three bands and without an SED fit (solid blue histogram). d) Cumulative distribution function of the integrated far-infrared luminosity of all sources with an acceptable SED fit (red pluses), and the integrated far-infrared luminosity of all Herschel point-like sources in the CNC with fluxes detected in minimum three bands and without an SED fit (blue crosses). Bottom panels: e) total luminosity obtained from the Robitaille models versus the integrated far-infrared luminosity for all sources with an acceptable SED fit. The solid red line marks a ratio of 1. f) Same as c), but now with the distribution of the integrated far-infrared luminosity of all Herschel point-like sources in the CNC with fluxes detected in minimum three bands and without an SED fit (solid blue) multiplied by the median value of Ltot/LFIR for YSOs with SED fit (dash-dotted blue).
Current usage metrics show cumulative count of Article Views (full-text article views including HTML views, PDF and ePub downloads, according to the available data) and Abstracts Views on Vision4Press platform.
Data correspond to usage on the plateform after 2015. The current usage metrics is available 48-96 hours after online publication and is updated daily on week days.
Initial download of the metrics may take a while.