Free Access
Fig. A.1
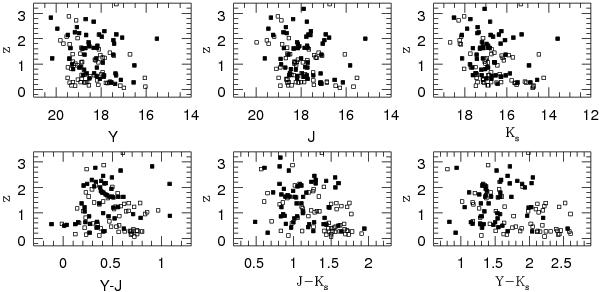
Distribution of redshift versus magnitudes (top line) and colours (bottom line) for known QSOs behind the Magellanic system. Filled symbols indicate sources classified as star-like in the VMC data and empty symbols those classified as galaxy-like.
Current usage metrics show cumulative count of Article Views (full-text article views including HTML views, PDF and ePub downloads, according to the available data) and Abstracts Views on Vision4Press platform.
Data correspond to usage on the plateform after 2015. The current usage metrics is available 48-96 hours after online publication and is updated daily on week days.
Initial download of the metrics may take a while.