Free Access
Fig. 5
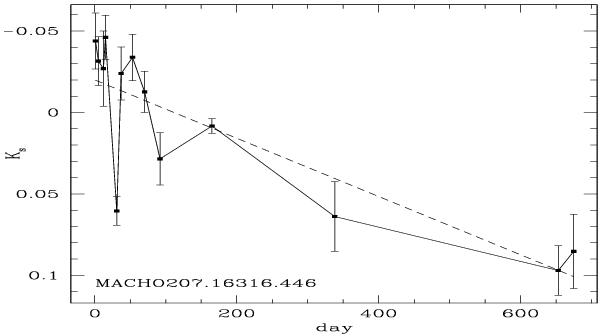
Mean Ks band QSO variation. Nightly averaged points are connected by a continuous line while a dashed line represents a linear fit through them. Error bars are the standard deviations from the mean. The slope of the line is 1.8 ± 0.4 × 10⁻⁴ mag/day where day 0 corresponds to the first observation in the VMC data.
Current usage metrics show cumulative count of Article Views (full-text article views including HTML views, PDF and ePub downloads, according to the available data) and Abstracts Views on Vision4Press platform.
Data correspond to usage on the plateform after 2015. The current usage metrics is available 48-96 hours after online publication and is updated daily on week days.
Initial download of the metrics may take a while.