Fig. 2
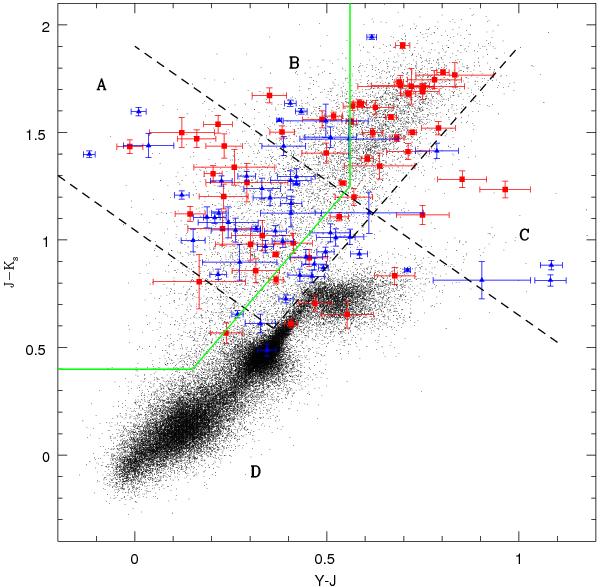
Colour–colour diagram showing the known QSOs classified as galaxy-like (red filled squares) and as star-like (blue filled triangles) in the VMC data. Sources from the LMC tile  with photometric errors < 0.1 mag and quality flags = 0 in each wave band are shown with black dots. Dashed black lines identify the regions where known QSOs are found while the green line encloses the region with PNe.
Current usage metrics show cumulative count of Article Views (full-text article views including HTML views, PDF and ePub downloads, according to the available data) and Abstracts Views on Vision4Press platform.
Data correspond to usage on the plateform after 2015. The current usage metrics is available 48-96 hours after online publication and is updated daily on week days.
Initial download of the metrics may take a while.