Fig. B.1
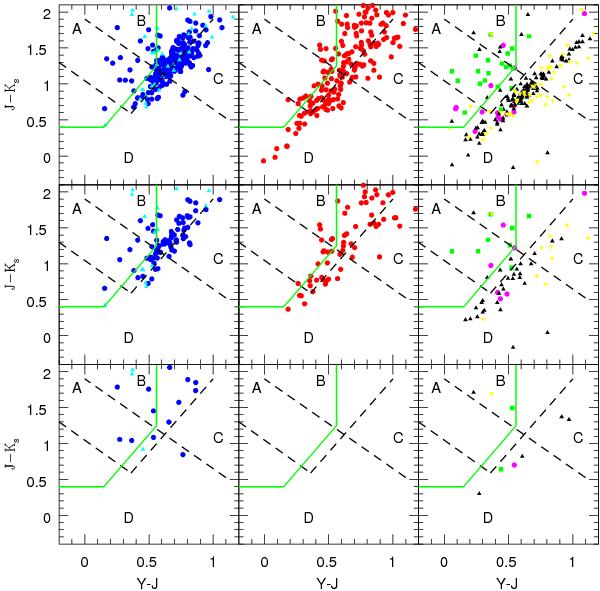
Distribution of the photometrically selected non-QSOs in the colour–colour diagram from present VMC data. (Top row) All positionally matched sources. (Middle row) Sources with a slope of variation in the Ks band > 10-4 mag/day. (Bottom row) Sources with photometric errors <0.1 mag and quality flags = 0 in the Y, J and Ks bands. (Left column) Definite (blue circles) and probable (cyan triangles) background galaxies. (Middle column) YSOs (red circles). (Right column) PNe (green squares), diffuse sources (yellow reversed triangles), evolved stars (magenta circles) and other stars (black triangles). Lines are as in Fig. 2.
Current usage metrics show cumulative count of Article Views (full-text article views including HTML views, PDF and ePub downloads, according to the available data) and Abstracts Views on Vision4Press platform.
Data correspond to usage on the plateform after 2015. The current usage metrics is available 48-96 hours after online publication and is updated daily on week days.
Initial download of the metrics may take a while.