Free Access
Fig. 7
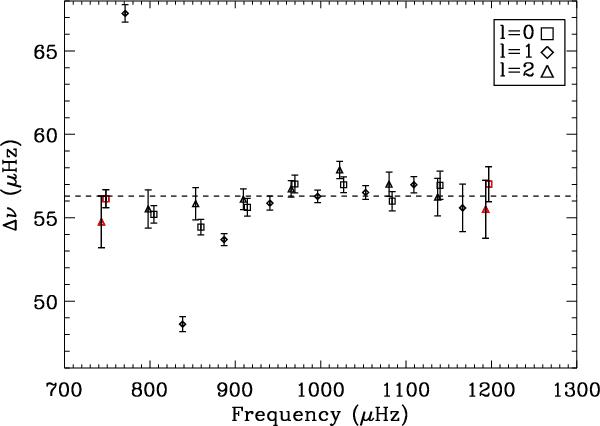
Large separation as a function of frequency for ℓ = 0, 1 and 2. The dashed line represents the mean large separation of the radial modes. The red squares at low- and high frequency represent the values obtained using the modes of the maximal list.
Current usage metrics show cumulative count of Article Views (full-text article views including HTML views, PDF and ePub downloads, according to the available data) and Abstracts Views on Vision4Press platform.
Data correspond to usage on the plateform after 2015. The current usage metrics is available 48-96 hours after online publication and is updated daily on week days.
Initial download of the metrics may take a while.