Fig. 5
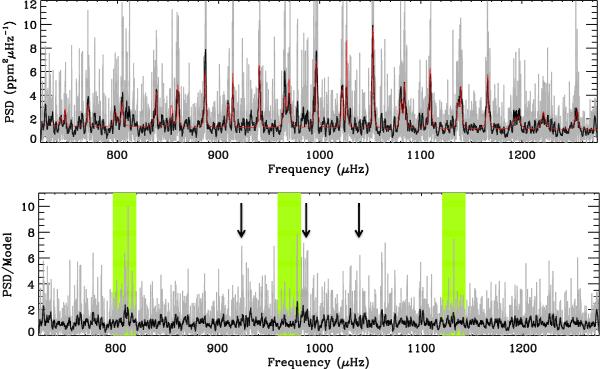
Upper panel: PSD of HD 169392 in the p-mode region at full resolution (grey) and smoothed over 15-bin wide boxcar (black). The red line corresponds to the fitted spectrum from refit after the frequency comparison stage. Lower panel: power spectral density for the p-mode region divided by the fitted model at full resolution (grey) and smoothed over 15 bins (black). Regions highlighted in green cover the regions corresponding to the harmonics of the CoRoT orbital period such that ν = (n × 161.7) ± (m × 11.5) μHz, where n and m are integers. The arrows show the positions where we would expect ℓ = 3 modes.
Current usage metrics show cumulative count of Article Views (full-text article views including HTML views, PDF and ePub downloads, according to the available data) and Abstracts Views on Vision4Press platform.
Data correspond to usage on the plateform after 2015. The current usage metrics is available 48-96 hours after online publication and is updated daily on week days.
Initial download of the metrics may take a while.