Free Access
Fig. 4
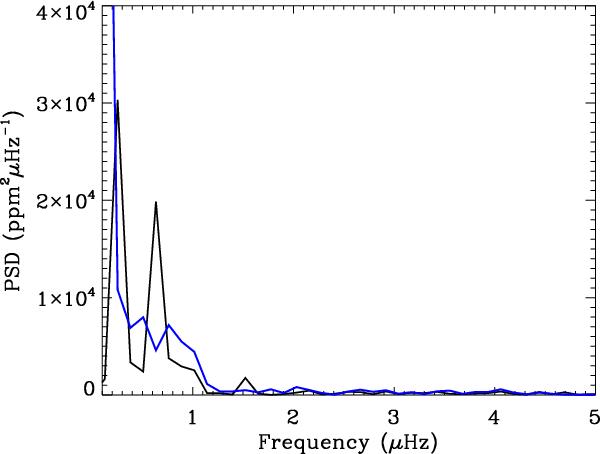
Low-frequency part of the power spectrum between 0.1 and 5 μHz. The black line corresponds to the light curve shown in Fig. 2. Two peaks are visible at 0.25 and 0.64 μHz. The blue line corresponds to the PSD of the light curve in which the jumps at 43.3 and 80.05 days were corrected.
Current usage metrics show cumulative count of Article Views (full-text article views including HTML views, PDF and ePub downloads, according to the available data) and Abstracts Views on Vision4Press platform.
Data correspond to usage on the plateform after 2015. The current usage metrics is available 48-96 hours after online publication and is updated daily on week days.
Initial download of the metrics may take a while.