Fig. 3
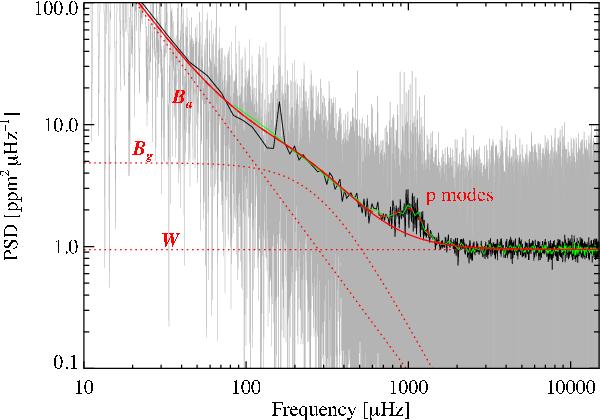
PSD of HD 169392 data (grey) that was modelled as explained in the text (red curves) with the usual three components: white noise (W), granulation noise (Bg), and stellar activity and/or large scales of convection (Ba). The red continuous line is the sum of these three components, resulting from the fit of the smoothed spectrum over Δν (green line). The black curve corresponds to the spectrum smoothed over 101 bins, i.e. 12.8 μHz.
Current usage metrics show cumulative count of Article Views (full-text article views including HTML views, PDF and ePub downloads, according to the available data) and Abstracts Views on Vision4Press platform.
Data correspond to usage on the plateform after 2015. The current usage metrics is available 48-96 hours after online publication and is updated daily on week days.
Initial download of the metrics may take a while.