Fig. 1
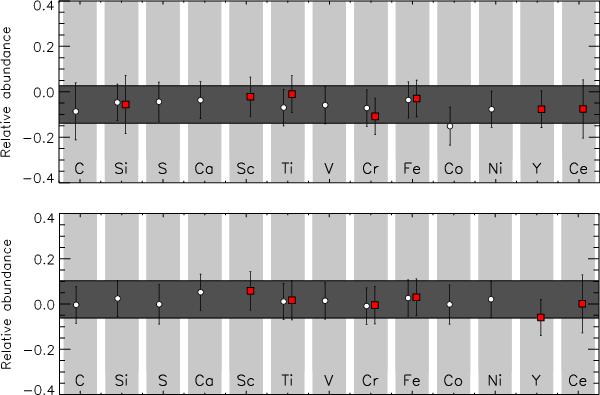
Abundances, relative to the Sun, for 14 elements in the A (top) and B (bottom) components of the system. Circles and box symbols are used for the mean abundance from neutral and singly ionised lines, respectively. The dark grey horizontal bar marks the mean metallicity within a 1-σ uncertainty range. Lithium is not plotted because it has a much higher value than the other elements in the A component.
Current usage metrics show cumulative count of Article Views (full-text article views including HTML views, PDF and ePub downloads, according to the available data) and Abstracts Views on Vision4Press platform.
Data correspond to usage on the plateform after 2015. The current usage metrics is available 48-96 hours after online publication and is updated daily on week days.
Initial download of the metrics may take a while.