Fig. 7
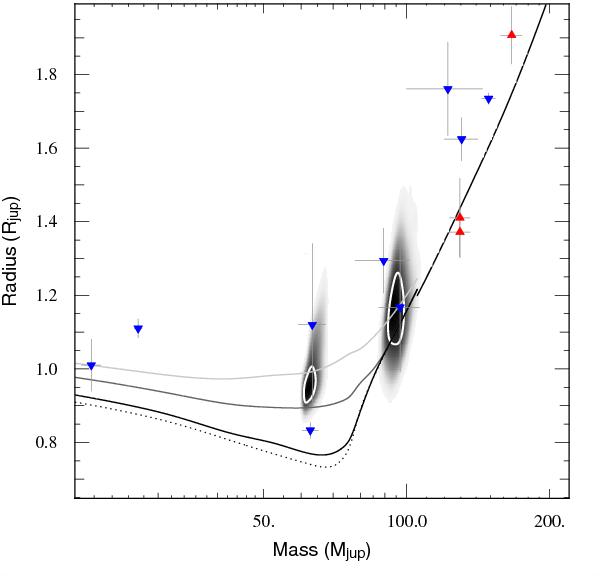
Mass-radius diagram for heavy planets, brown dwarfs and low-mass stars. The radius axis corresponds to the size range of Jupiter-mass planets discovered so far. Inverted blue triangles show eclipsing/transiting SB1s, upright red triangles denote interferometric measurements. The two (M2, R2) posterior probability density distributions for WASP-30b and J1219–39b are drawn in grey with their 1 − σ confidence regions in white. Models by Baraffe et al. (2003, 1998) are also displayed with ages 5 Gyr (black), 1 Gyr (dark grey), 500 Myr (light grey) and 10 Gyr (dotted). Models are for [M/H] = 0. Observational data were taken from Lane et al. (2001); Ségransan et al. (2003); Pont et al. (2005a,b, 2006); Beatty et al. (2007); Deleuil et al. (2008); Demory et al. (2009); Bouchy et al. (2011); Johnson et al. (2011); Ofir et al. (2012); Siverd et al. (2012).
Current usage metrics show cumulative count of Article Views (full-text article views including HTML views, PDF and ePub downloads, according to the available data) and Abstracts Views on Vision4Press platform.
Data correspond to usage on the plateform after 2015. The current usage metrics is available 48-96 hours after online publication and is updated daily on week days.
Initial download of the metrics may take a while.