Fig. 5
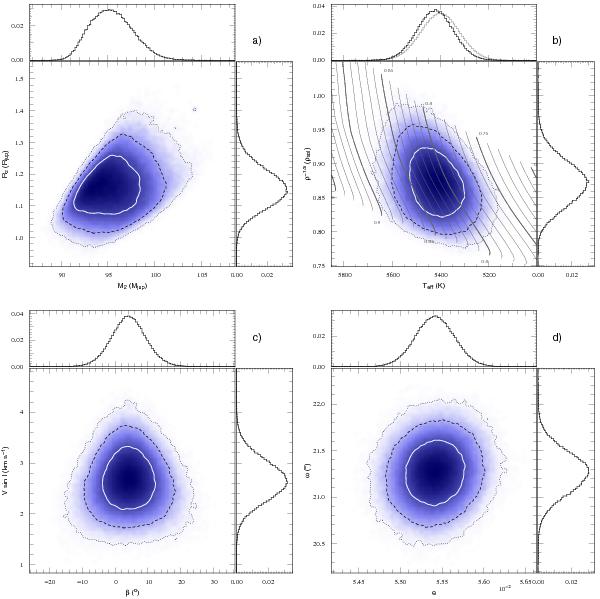
J1219–39: the central panels show posterior probability-density distributions from the MCMC output, with contours at the 1-, 2- and 3-σ confidence regions. The side panels show marginalised distributions as histograms in black. Where used, the priors are shown in grey. Panel a) radius and mass of J1219–39b. b) modified Hertzsprung-Russell diagram over-plotted with the Geneva evolution tracks. Masses are indicated in M⊙. c) V sin i⋆ versus β from fitting the Rossiter-McLaughlin effect. d) the eccentricity e and argument of periastron ω.
Current usage metrics show cumulative count of Article Views (full-text article views including HTML views, PDF and ePub downloads, according to the available data) and Abstracts Views on Vision4Press platform.
Data correspond to usage on the plateform after 2015. The current usage metrics is available 48-96 hours after online publication and is updated daily on week days.
Initial download of the metrics may take a while.