Fig. 2
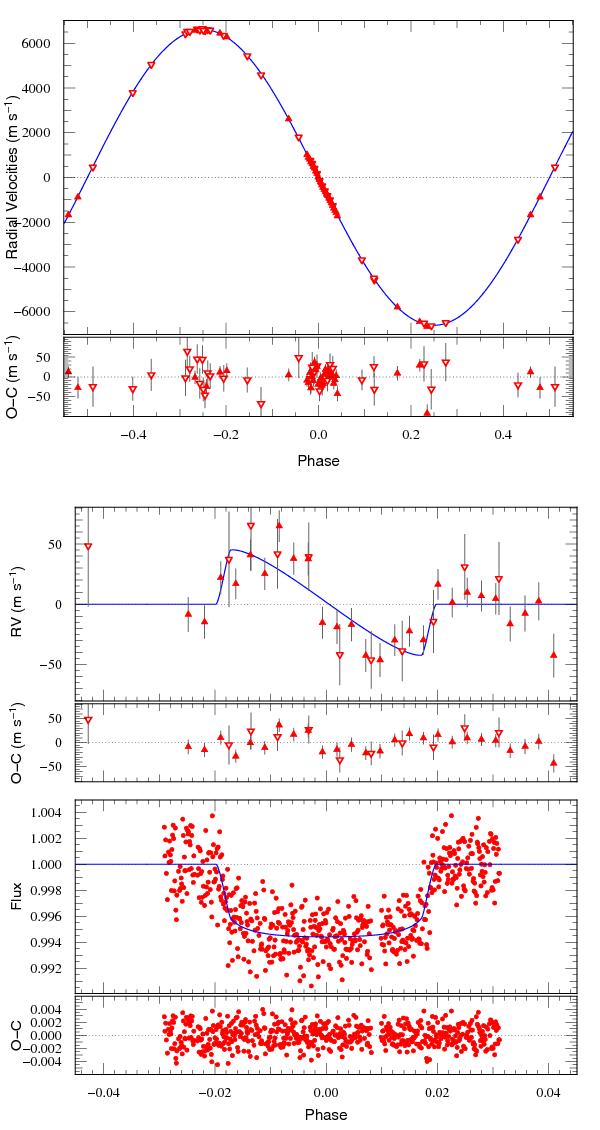
Top: radial velocities on WASP-30 plotted with a circular Keplerian model and their residuals. CORALIE data is shown as inverted, empty, triangles. HARPS is show as upright triangles. Middle: zoom on the Rossiter-McLaughlin effect. Bottom: TRAPPIST I + z photometry and model over-plotted. The interruption of the observations is due to a telescope meridian flip.
Current usage metrics show cumulative count of Article Views (full-text article views including HTML views, PDF and ePub downloads, according to the available data) and Abstracts Views on Vision4Press platform.
Data correspond to usage on the plateform after 2015. The current usage metrics is available 48-96 hours after online publication and is updated daily on week days.
Initial download of the metrics may take a while.