Fig. 1
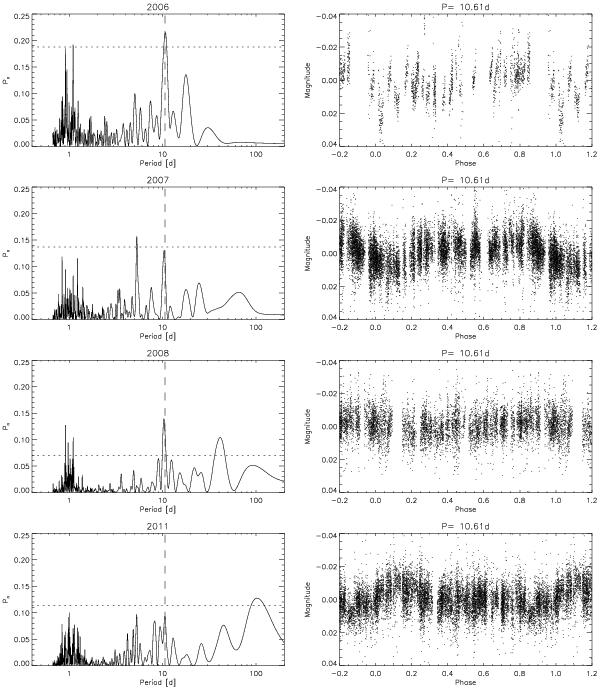
Left panels: periodograms for the WASP data from the different observing seasons for J1219–39. Horizontal lines indicate false alarm probability levels FAP = 0.01 and vertical lines show our assumed rotational modulation period of P = 10.6 d. The year of observation in given in the title. Right panels: lightcurves folded on the period P = 10.61 d.
Current usage metrics show cumulative count of Article Views (full-text article views including HTML views, PDF and ePub downloads, according to the available data) and Abstracts Views on Vision4Press platform.
Data correspond to usage on the plateform after 2015. The current usage metrics is available 48-96 hours after online publication and is updated daily on week days.
Initial download of the metrics may take a while.