Fig. 6
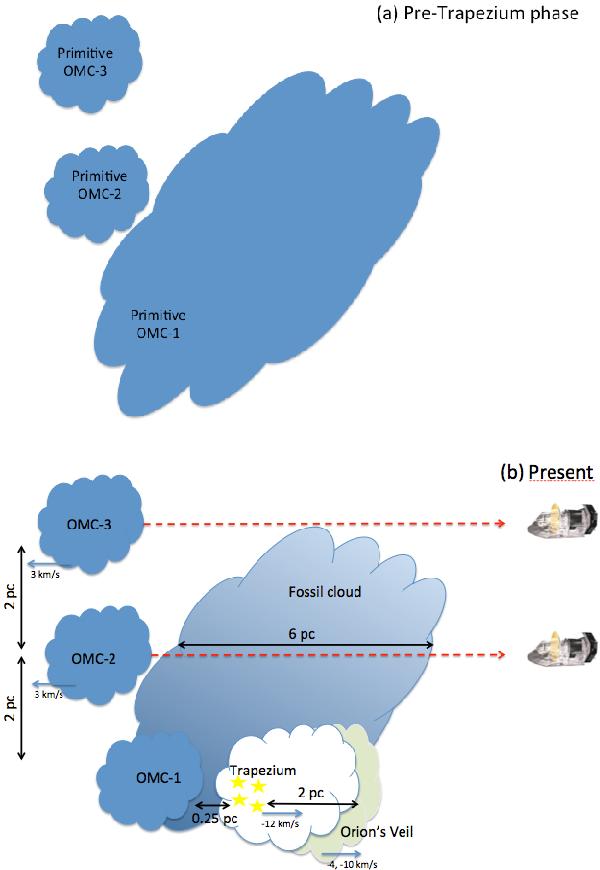
Sketch of the OMC-1/2/3 region as it might have appeared before the formation of the Trapezium cluster (top), and how it looks at present time (bottom). The foreground cloud we detected is labelled “fossil cloud”, and the colour gradient across it represents a density gradient roughly in the north-south direction (see text). The sizes of each component and their velocities relative to the systemic velocity of OMC-1 and the foreground cloud (i.e. VLSR = 9 km s-1) are marked. The observer, represented by a small picture of the Herschel satellite, is situated to the right of each panel.
Current usage metrics show cumulative count of Article Views (full-text article views including HTML views, PDF and ePub downloads, according to the available data) and Abstracts Views on Vision4Press platform.
Data correspond to usage on the plateform after 2015. The current usage metrics is available 48-96 hours after online publication and is updated daily on week days.
Initial download of the metrics may take a while.