Fig. 9
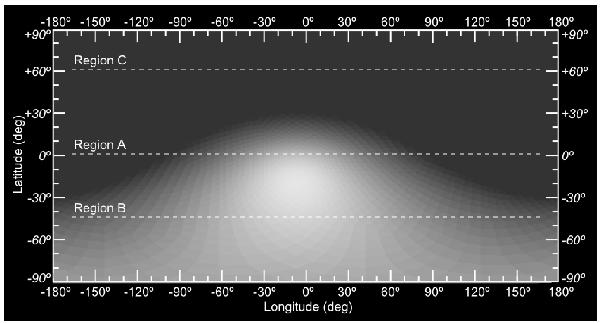
Typical illumination of the nucleus in February 2009, at perihelion, calculated on the ellipsoid reference shape from Lamy et al. (2007). The dotted lines indicate the latitudes of active regions determined by COSSIM. The figure illustrates the clear difference in activity that can be expected between regions. For instance, one can see that region B is almost continuously illuminated, whereas region C is in polar winter at perihelion. Of course the real illumination of the nucleus depends strongly on the shape of the body and this picture cannot be fully representative of the local conditions.
Current usage metrics show cumulative count of Article Views (full-text article views including HTML views, PDF and ePub downloads, according to the available data) and Abstracts Views on Vision4Press platform.
Data correspond to usage on the plateform after 2015. The current usage metrics is available 48-96 hours after online publication and is updated daily on week days.
Initial download of the metrics may take a while.