Free Access
Fig. 10
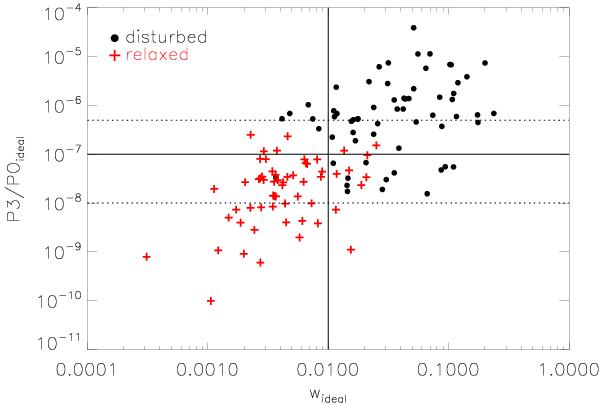
Motivation for the simple and morphological boundaries for P3/P0 and w. We show the P3/P0–w plane for ideal simulated cluster images. The classification into relaxed (red crosses) and disturbed (black circles) was done visually. The boundaries are displayed by horizontal and vertical lines and fit the data well.
Current usage metrics show cumulative count of Article Views (full-text article views including HTML views, PDF and ePub downloads, according to the available data) and Abstracts Views on Vision4Press platform.
Data correspond to usage on the plateform after 2015. The current usage metrics is available 48-96 hours after online publication and is updated daily on week days.
Initial download of the metrics may take a while.