Free Access
Fig. 5
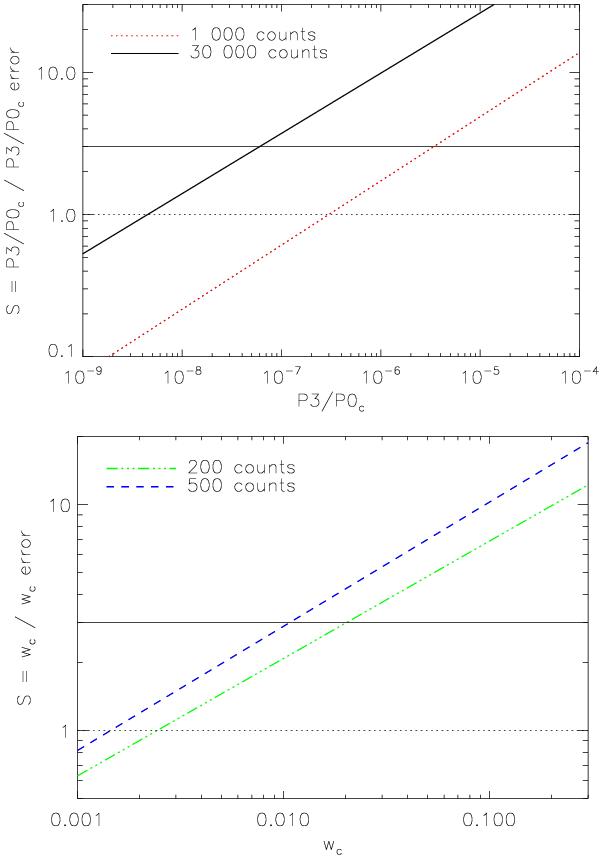
Significance S of the P3/P0 (top) and w (bottom) measurements for different counts. Top: 1000 red dotted line and 30 000 black solid line, bottom: 200 green dot-dashed, 500 blue dashed line. The different thresholds are marked (S = 3: solid line, S = 1 dotted line).
This figure is made of several images, please see below:
Current usage metrics show cumulative count of Article Views (full-text article views including HTML views, PDF and ePub downloads, according to the available data) and Abstracts Views on Vision4Press platform.
Data correspond to usage on the plateform after 2015. The current usage metrics is available 48-96 hours after online publication and is updated daily on week days.
Initial download of the metrics may take a while.