Free Access
Fig. 2
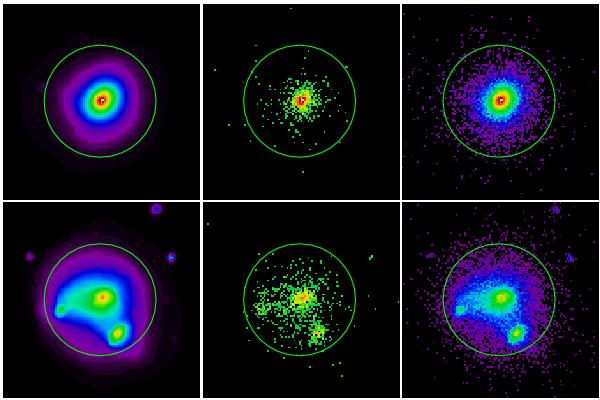
Example of a relaxed (upper panels) and a disturbed (lower panels) simulated cluster X-ray image including no noise (left) and poissonized images with 1000 (middle) and 30 000 counts (right) within r500 (indicated by circle).
Current usage metrics show cumulative count of Article Views (full-text article views including HTML views, PDF and ePub downloads, according to the available data) and Abstracts Views on Vision4Press platform.
Data correspond to usage on the plateform after 2015. The current usage metrics is available 48-96 hours after online publication and is updated daily on week days.
Initial download of the metrics may take a while.