Fig. 15
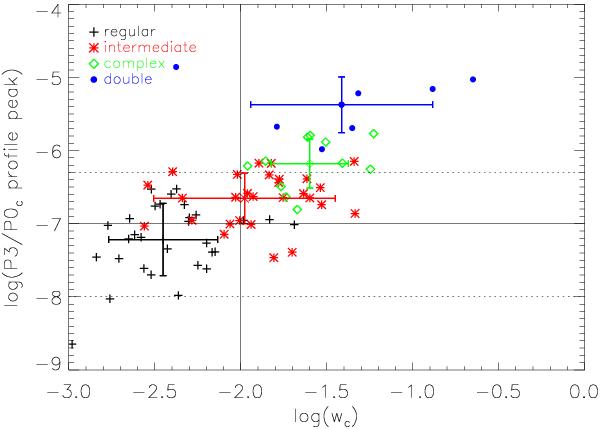
Relation between the significant peak (S > 0) of the P3/P0 profile and the center shift parameter for different morphologies. A tighter correlation than in the P3/P0–w plane (Fig. 13) can be seen. In addition, a clearer separation between the different morphological categories is apparent. The horizontal lines mark the P3/P0 boundaries (solid: simple at 10-7, dotted: morphological at 5 × 10⁻⁷ and 10-8), the vertical line displays the wboundary at 10-2. The colors are as described in Fig. 13.
Current usage metrics show cumulative count of Article Views (full-text article views including HTML views, PDF and ePub downloads, according to the available data) and Abstracts Views on Vision4Press platform.
Data correspond to usage on the plateform after 2015. The current usage metrics is available 48-96 hours after online publication and is updated daily on week days.
Initial download of the metrics may take a while.