Free Access
Fig. 1
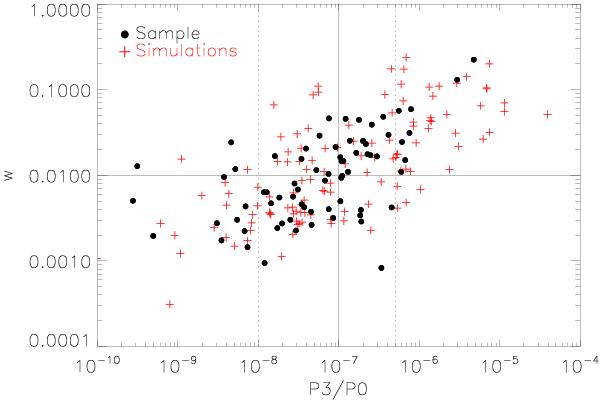
Comparison of the sample of 80 clusters observed with XMM-Newton (black circles) and 121 simulated X-ray cluster images (red crosses) in the P3/P0–w plane. The solid and dotted lines show the different morphological ranges as discussed below in Sect. 5.
Current usage metrics show cumulative count of Article Views (full-text article views including HTML views, PDF and ePub downloads, according to the available data) and Abstracts Views on Vision4Press platform.
Data correspond to usage on the plateform after 2015. The current usage metrics is available 48-96 hours after online publication and is updated daily on week days.
Initial download of the metrics may take a while.