Fig. 4
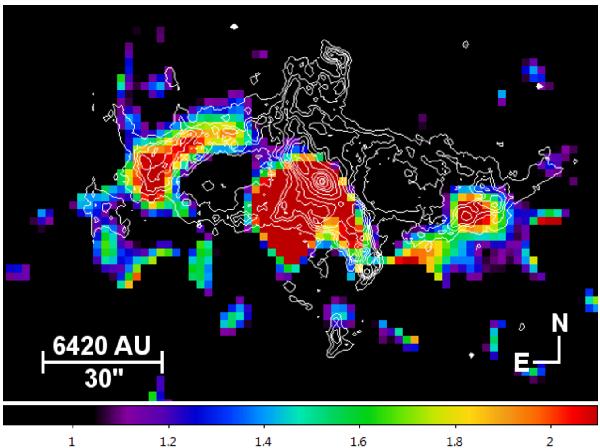
Map from the ratio of flux values between the deconvolved 70 μm and 160 μm PACS images of R Aqr overplotted with contours from an EMMI observation at 653 nm [N ii]. The colour code represents the flux ratio between 70 and 160 μm. Both arms show gradients in the flux ratio, which is a signature of continuum dust emission. Furthermore, the highest flux ratio occurs at the ends of both arms.
Current usage metrics show cumulative count of Article Views (full-text article views including HTML views, PDF and ePub downloads, according to the available data) and Abstracts Views on Vision4Press platform.
Data correspond to usage on the plateform after 2015. The current usage metrics is available 48-96 hours after online publication and is updated daily on week days.
Initial download of the metrics may take a while.