Fig. 2
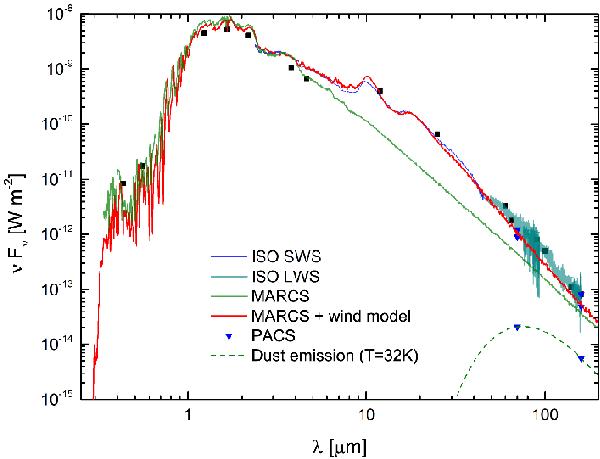
SED of R Aqr described by single-band photometry (filled squares) compiled from the literature as well as the available ISO-SWS (blue line) and -LWS (cyan line) spectra. Overplotted are the synthetic spectra based on models for the photosphere (MARCS; green line) and the combined photosphere + wind (red line; see Section 4.1.2 for details). In addition, aperture photometry of the PACS 70 μm and 160 μm bands (triangles) is included. There are three data points for each of these measurements. From bottom to top: aperture photometry (i) of the eastern arm; (ii) of the central source; and (iii) of the whole IR-emitting region. The dotted line represents the model for the dust emission of the eastern arm.
Current usage metrics show cumulative count of Article Views (full-text article views including HTML views, PDF and ePub downloads, according to the available data) and Abstracts Views on Vision4Press platform.
Data correspond to usage on the plateform after 2015. The current usage metrics is available 48-96 hours after online publication and is updated daily on week days.
Initial download of the metrics may take a while.