Fig. 3
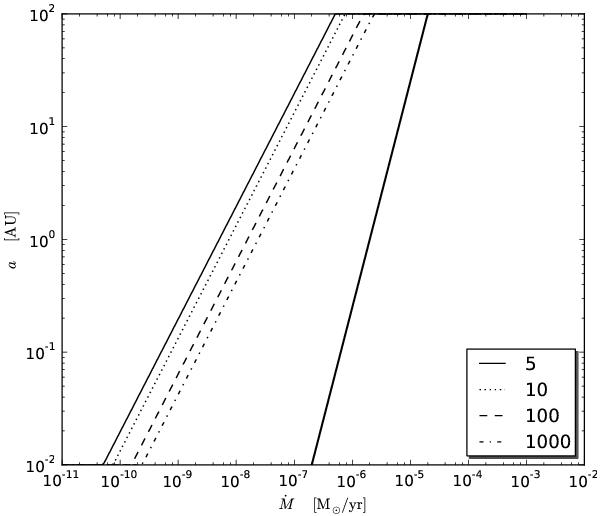
Contour lines showing the dependence of obscuration on mass-loss rate and binary separation, for photons emitted at 350 eV. The left-most solid line corresponds to an attenuation factor of 5, the dotted line to an attenuation of 10, dashed to an attenuation of 100, and dot-dashed to an attenuation of 1000. The right-most solid line is the critical mass-loss rate ṀStr; to the left of this line, the wind is insufficiently dense to sustain a clearly defined ionized region around the source. To the right of it, a clearly defined ionized region exists around the source, while the material outside of this region is neutral.
Current usage metrics show cumulative count of Article Views (full-text article views including HTML views, PDF and ePub downloads, according to the available data) and Abstracts Views on Vision4Press platform.
Data correspond to usage on the plateform after 2015. The current usage metrics is available 48-96 hours after online publication and is updated daily on week days.
Initial download of the metrics may take a while.