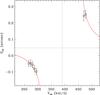
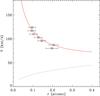
Fig. 10

Results of the fit to the spectroastrometric Brγ data. The left panel shows the rotation curve projected along the line of nodes, Sch vs. Vch. The right panel shows the r = |Sch − S0| vs. V = |Vch − Vsys| rotation curve. The solid red lines represent the curves expected from the model. The dotted line in right panel represents the rotation curve due to the star component of the gravitational potential.
Current usage metrics show cumulative count of Article Views (full-text article views including HTML views, PDF and ePub downloads, according to the available data) and Abstracts Views on Vision4Press platform.
Data correspond to usage on the plateform after 2015. The current usage metrics is available 48-96 hours after online publication and is updated daily on week days.
Initial download of the metrics may take a while.