Fig. A.1
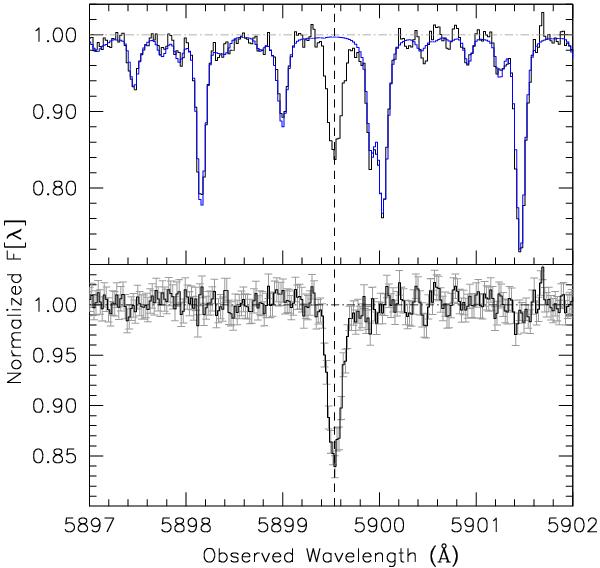
Example of telluric features removal for the SARG spectrum in the region of Na i D1. Upper panel: observed data (black line) and best fit LBLRTM model (blue line). Lower panel: telluric-corrected spectrum. The dashed vertical line marks the position of Na i D1 (vhel ~ 180 km s-1). The S/N ratio on the continuum is about 100 (the error-bars indicate the estimated rms noise).
Current usage metrics show cumulative count of Article Views (full-text article views including HTML views, PDF and ePub downloads, according to the available data) and Abstracts Views on Vision4Press platform.
Data correspond to usage on the plateform after 2015. The current usage metrics is available 48-96 hours after online publication and is updated daily on week days.
Initial download of the metrics may take a while.