Free Access
Fig. 3
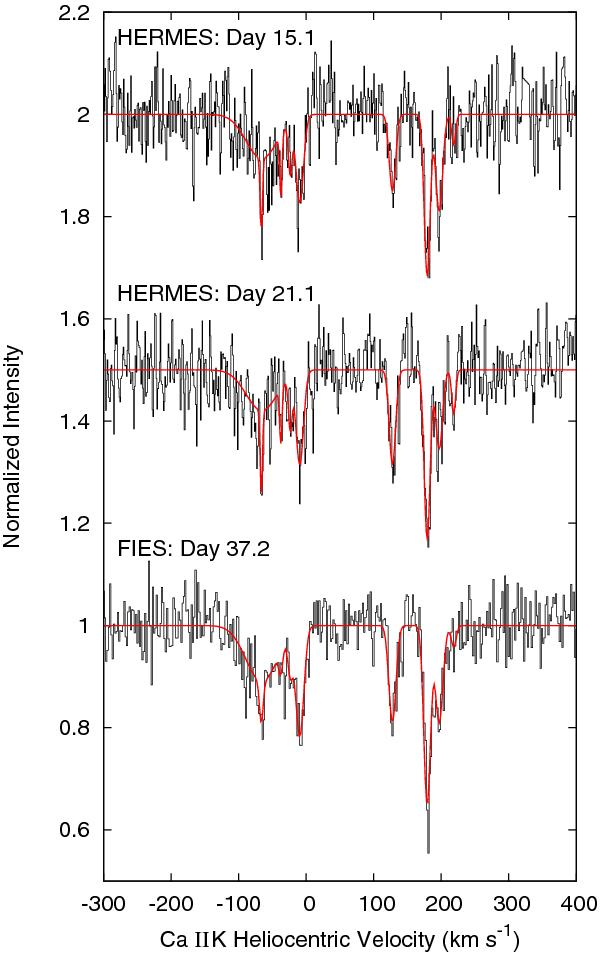
Ca ii K spectra for each epoch for which these data were obtained (black histograms), with best-fit models overlaid (red curves). Spectra were normalized and offset vertically for display. Heliocentric velocity scale is given with respect to the Ca ii K line rest wavelength.
Current usage metrics show cumulative count of Article Views (full-text article views including HTML views, PDF and ePub downloads, according to the available data) and Abstracts Views on Vision4Press platform.
Data correspond to usage on the plateform after 2015. The current usage metrics is available 48-96 hours after online publication and is updated daily on week days.
Initial download of the metrics may take a while.