Fig. 8
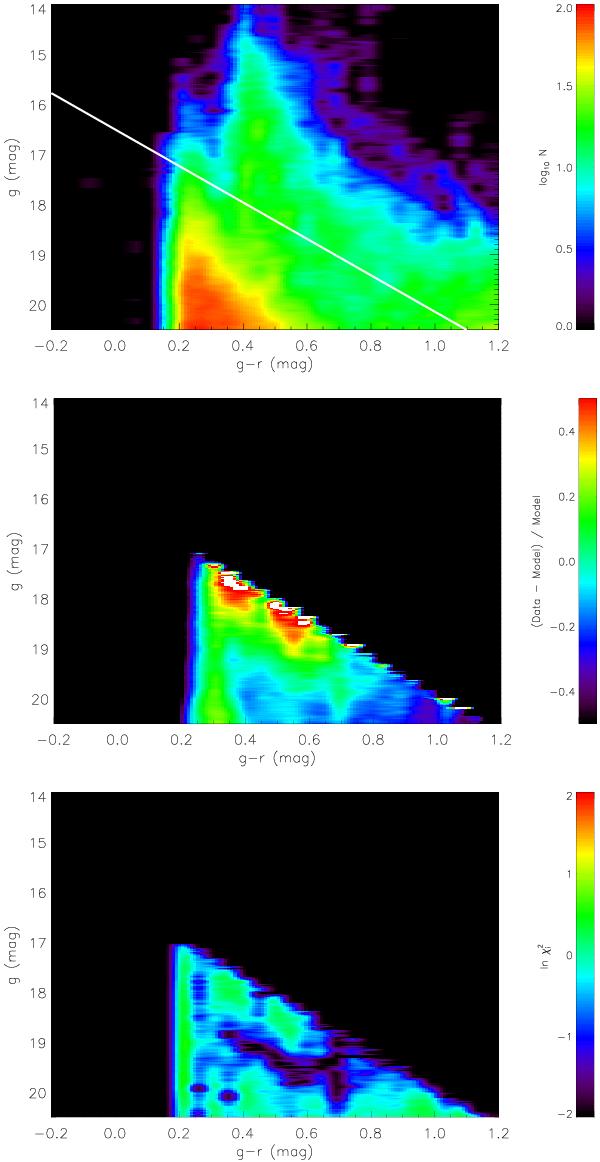
Same as in Fig. 7 but for thick disc plus halo stars and the parameter set 5. The upper panel is the Hess diagram of the halo plus the thick disc of Set 5. The white thick line in Fig. 6 shows the area in which the thin disc is negligible. The two lower panels are the relative difference and χ2 distribution restricted in the thick disc area. (A colour version is available on-line.)
Current usage metrics show cumulative count of Article Views (full-text article views including HTML views, PDF and ePub downloads, according to the available data) and Abstracts Views on Vision4Press platform.
Data correspond to usage on the plateform after 2015. The current usage metrics is available 48-96 hours after online publication and is updated daily on week days.
Initial download of the metrics may take a while.