Fig. 7
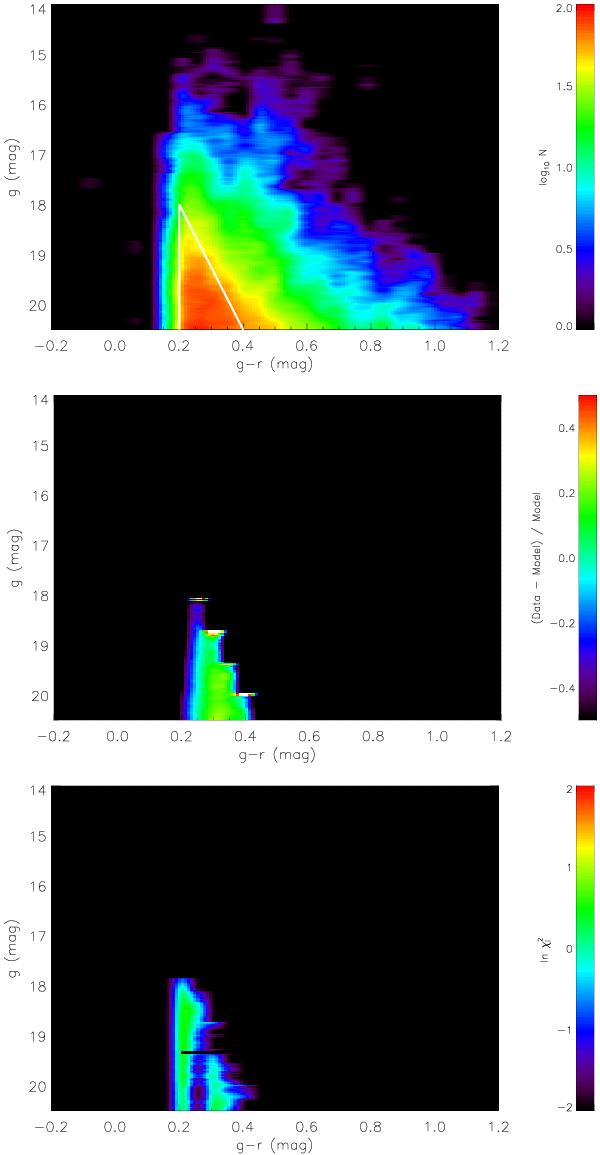
Hess diagram, relative differences, and χ2 distribution (top to bottom) of the best-fit halo in TRILEGAL for parameter set 5. The upper panel is the Hess diagram of the halo of set 5. The white thick lines enclose the triangle mentioned in Fig. 6. The two lower panels are the relative difference and χ2 distribution restricted in the halo area. The coding is the same as in the rows of Fig. 5. (A colour version is available on-line.)
Current usage metrics show cumulative count of Article Views (full-text article views including HTML views, PDF and ePub downloads, according to the available data) and Abstracts Views on Vision4Press platform.
Data correspond to usage on the plateform after 2015. The current usage metrics is available 48-96 hours after online publication and is updated daily on week days.
Initial download of the metrics may take a while.