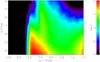
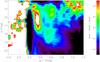
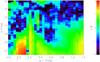
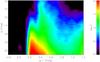
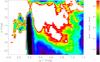
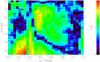
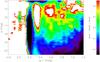
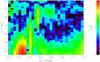
Fig. 5
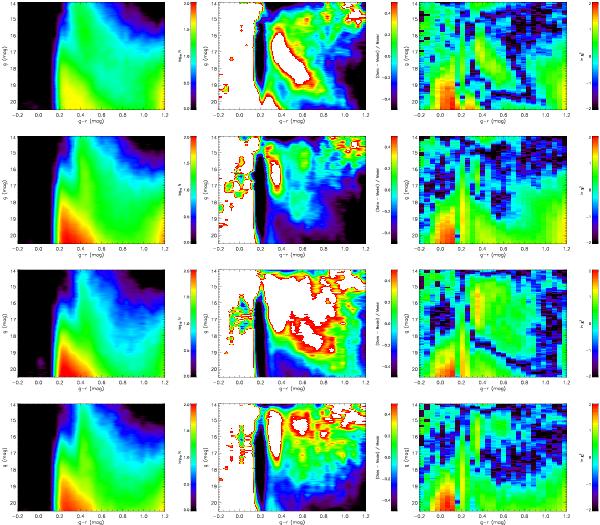
Hess diagrams (first column), relative differences (second column) between the Hess diagrams of the models and the SDSS observations, and the χ2 diagrams (last column). From top to bottom, we show the comparisons based on the parameter sets 1 to 4, respectively. The x- and y-axes correspond to the colour index  and de-reddened apparent magnitude
  . The left column shows the stellar density using a colour coding from 0 to 100 stars per square degree per 1 mag and 0.1 colour mag on a logarithmic scale. The middle panels are the relative differences between data and models with a colour coding from −50% to +50%. The right panels are the lnχ2 distributions with a colour coding from −2 to + 2. Note that the colour ranges in the middle and right panels cover much larger ranges than in Fig. 5 of Just et al. (2011). (A colour version is available on-line.)

Current usage metrics show cumulative count of Article Views (full-text article views including HTML views, PDF and ePub downloads, according to the available data) and Abstracts Views on Vision4Press platform.
Data correspond to usage on the plateform after 2015. The current usage metrics is available 48-96 hours after online publication and is updated daily on week days.
Initial download of the metrics may take a while.