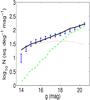
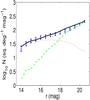
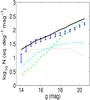
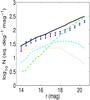
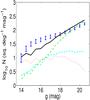
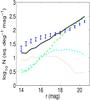
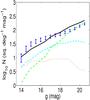
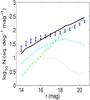
Fig. 4

The magnitude distributions of the SDSS observations and the TRILEGAL simulations generated with parameter sets 1 to 4 (top to bottom). The x- and y-axes are similar to the bottom panel of Fig. 1. The error bars (blue) are from SDSS DR7 data with the colour limit of 0.2 ≤ (g − r) < 1.2. The black solid line represents the model star count predictions of TRILEGAL. The dotted (red), dashed (cyan), and dot-dashed (green) lines stand for the thin disc, thick disc, and halo of the TRILEGAL model, respectively. (A colour version is available on-line.)
Current usage metrics show cumulative count of Article Views (full-text article views including HTML views, PDF and ePub downloads, according to the available data) and Abstracts Views on Vision4Press platform.
Data correspond to usage on the plateform after 2015. The current usage metrics is available 48-96 hours after online publication and is updated daily on week days.
Initial download of the metrics may take a while.