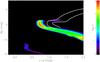
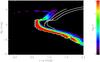
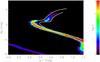
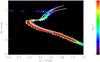
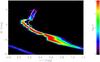
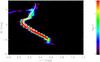
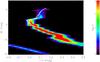
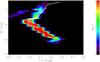
Fig. 12

The colour–absolute magnitude diagrams of the thick disc and halo of the Besançon model and the fiducial isochrones of globular clusters in (g − r,Mg). The Hess diagrams show the stellar distributions in (u − g,Mg), (g − r,Mg), (r − i,Mr), and (i − z,Mi) from top to bottom for the thick disc (left column) and halo (right column) simulated by the Besançon model. The overplotted thick lines (white) are the An et al. (2008)’s fiducial isochrones based on SDSS observations of globular clusters. M 5 and M 71 are overplotted on the thick disc panels. M 5, NGC 4147, and M 92 are overplotted on the halo panels. (A colour version is available on-line.)
Current usage metrics show cumulative count of Article Views (full-text article views including HTML views, PDF and ePub downloads, according to the available data) and Abstracts Views on Vision4Press platform.
Data correspond to usage on the plateform after 2015. The current usage metrics is available 48-96 hours after online publication and is updated daily on week days.
Initial download of the metrics may take a while.