Fig. 1

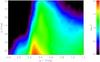
Top: Hess diagram of the NGP stellar sample taken from SDSS DR7 and covering 313.36 deg2. The x-axis is the de-reddened colour index (g − r) and the y-axis is the de-reddened apparent magnitude g. Number densities per square degree, 1 mag in g and 0.1 mag in (g − r), are colour-coded on a logarithmic scale. The stellar number density has been smoothed. Bottom: de-reddened g magnitude distribution of stars in the same colour range but with an extended magnitude range. The bins of this luminosity function are the logarithmic star numbers per 0.5 mag. The assumed Poissonian error bars are also indicated. (A colour version is available on-line.)
Current usage metrics show cumulative count of Article Views (full-text article views including HTML views, PDF and ePub downloads, according to the available data) and Abstracts Views on Vision4Press platform.
Data correspond to usage on the plateform after 2015. The current usage metrics is available 48-96 hours after online publication and is updated daily on week days.
Initial download of the metrics may take a while.