Fig. 4
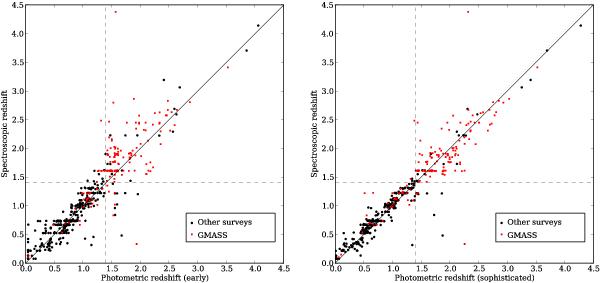
Plots of spectroscopic versus photometric redshifts for 309 galaxies in the GMASS field with secure redshifts determined in other surveys (dark (black) circles) and 160 galaxies with secure redshifts determined by GMASS spectroscopy (bright (red) squares). The latter set of redshifts are shown here only to illustrate the quality of the photometric redshifts. They were not used to optimise the photometric redshifts itself. The plot on the left shows the early photometric redshifts used to select the spectroscopic sample (based on the partly available IRAC images available at that time), while the plot on the right shows the photometric redshifts determined later, using all four IRAC bands, but based on the same set of 309 spectroscopic redshifts.
Current usage metrics show cumulative count of Article Views (full-text article views including HTML views, PDF and ePub downloads, according to the available data) and Abstracts Views on Vision4Press platform.
Data correspond to usage on the plateform after 2015. The current usage metrics is available 48-96 hours after online publication and is updated daily on week days.
Initial download of the metrics may take a while.