Fig. 3
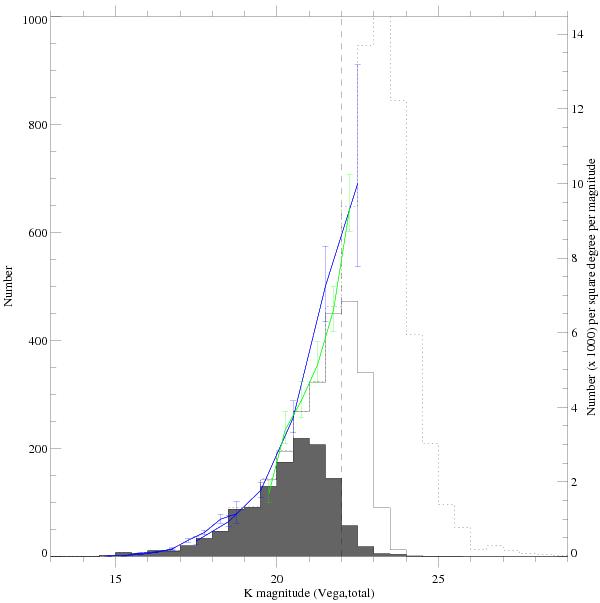
K band counts for the 49.75 arcmin2 GMASS field. Also indicated on the right-hand axis are counts/mag/arcmin2. The solid histogram is for the 3.3σK band catalogue, while the dashed histogram is for the (faint) 2.2σ catalogue. The filled histogram indicated which objects are in the GMASS catalogue (i.e., are counterparts of an unblended 4.5 μm source). The vertical dashed line indicated the completeness limit for the 3.3σ catalogue. Overplotted are counts from Gardner et al. (1993, green/light line) and Saracco et al. (2001, blue/dark line).
Current usage metrics show cumulative count of Article Views (full-text article views including HTML views, PDF and ePub downloads, according to the available data) and Abstracts Views on Vision4Press platform.
Data correspond to usage on the plateform after 2015. The current usage metrics is available 48-96 hours after online publication and is updated daily on week days.
Initial download of the metrics may take a while.