Fig. 2
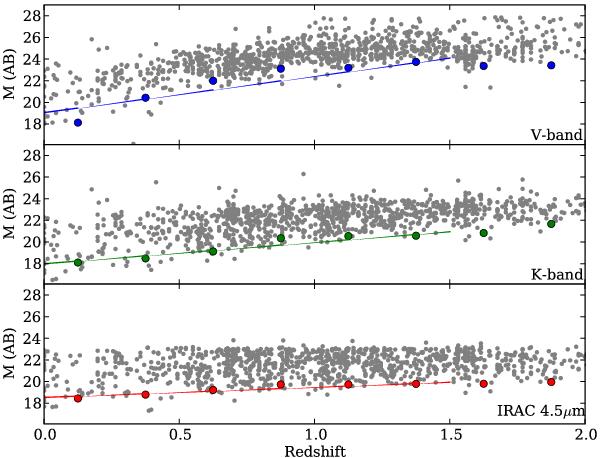
Magnitudes as a function of photometric redshift for the GMASS sample, in the ACS F606W band (top), ISAAC Ks band (middle), and IRAC 4.5 μm (bottom). A straight line is fit to the median of the brightest 5% in each Δz = 0.25 bin, up to z = 1.5, that has a slope of 3.4, 2.0, and 0.9, respectively. This shows the relative strength of the K-correction for these bands, which is strong in V-band, and much weaker in the infrared IRAC band.
Current usage metrics show cumulative count of Article Views (full-text article views including HTML views, PDF and ePub downloads, according to the available data) and Abstracts Views on Vision4Press platform.
Data correspond to usage on the plateform after 2015. The current usage metrics is available 48-96 hours after online publication and is updated daily on week days.
Initial download of the metrics may take a while.