Fig. 13
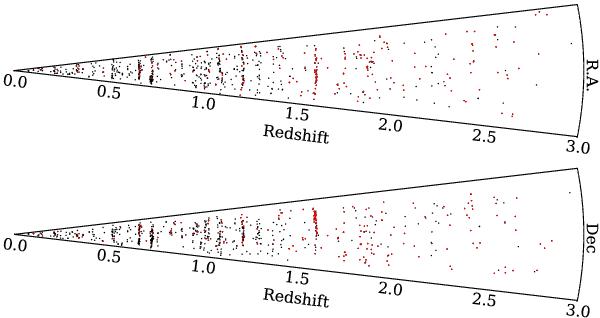
Cone plots showing the projection in RA in the top panel and declination in the bottom panel of the spatial distribution of galaxies in the GMASS field. Only galaxies with spectroscopic redshifts up to z = 3.0 are shown. Red symbols indicate redshifts determined by spectroscopy from the GMASS survey. The angle of each cones was stretched by a factor of six to help visualisation.
Current usage metrics show cumulative count of Article Views (full-text article views including HTML views, PDF and ePub downloads, according to the available data) and Abstracts Views on Vision4Press platform.
Data correspond to usage on the plateform after 2015. The current usage metrics is available 48-96 hours after online publication and is updated daily on week days.
Initial download of the metrics may take a while.