Fig. 2
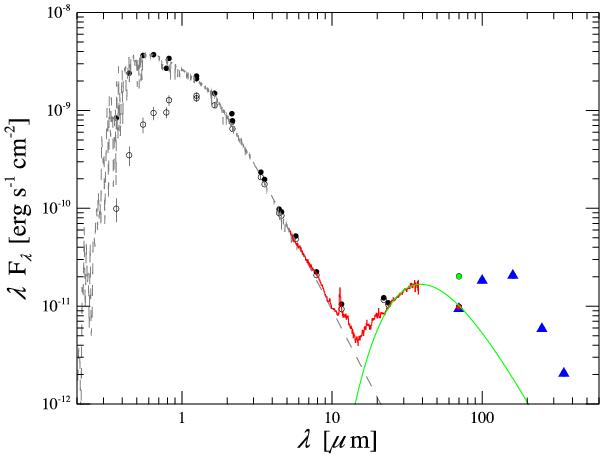
Spectral energy distribution of T54. Open circles are observed optical, DENIS, 2MASS, WISE PRC, Spitzer IRAC, and MIPS 24 μm fluxes from the literature. Solid black circles are the fluxes dereddened with an AV of 1.78 mag using the law from Weingartner & Draine (2001). The red line is the Spitzer IRS spectrum. The dashed line is the G8 NEXTGEN stellar model that best fits the optical photometry. At 70 μm, PACS fluxes displayed are from the star only (red solid circle), from the extended emission only (blue solid triangle) and from both (green solid circle). Longer wavelength Herschel flux values, not from the star position, are shown as blue solid triangles. The green solid line represents a T = 94 K blackbody curve fit to the mid-IR fluxes.
Current usage metrics show cumulative count of Article Views (full-text article views including HTML views, PDF and ePub downloads, according to the available data) and Abstracts Views on Vision4Press platform.
Data correspond to usage on the plateform after 2015. The current usage metrics is available 48-96 hours after online publication and is updated daily on week days.
Initial download of the metrics may take a while.