Fig. 1
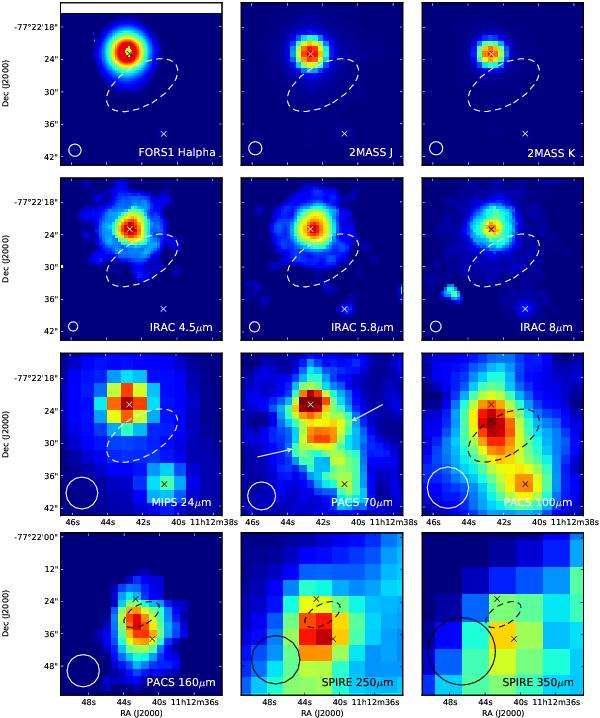
Images of T54 at different wavelengths. North is up, east is left. The bottom row images show a region twice as large as the other ones. The diameter of the circles in the bottom left of each image represents the FWHM of the PSF for the different observations. The northern cross is centered on the position of T54 from the 2MASS Point Source Catalog, while the southern one corresponds to the position of 2MASS J11124076-7722378. Arrows indicate the location of extended emission as detected at 70 μm, and the dashed ellipse represents the same in all other images. Unlabeled objects represent artifacts.
Current usage metrics show cumulative count of Article Views (full-text article views including HTML views, PDF and ePub downloads, according to the available data) and Abstracts Views on Vision4Press platform.
Data correspond to usage on the plateform after 2015. The current usage metrics is available 48-96 hours after online publication and is updated daily on week days.
Initial download of the metrics may take a while.