Fig. 7
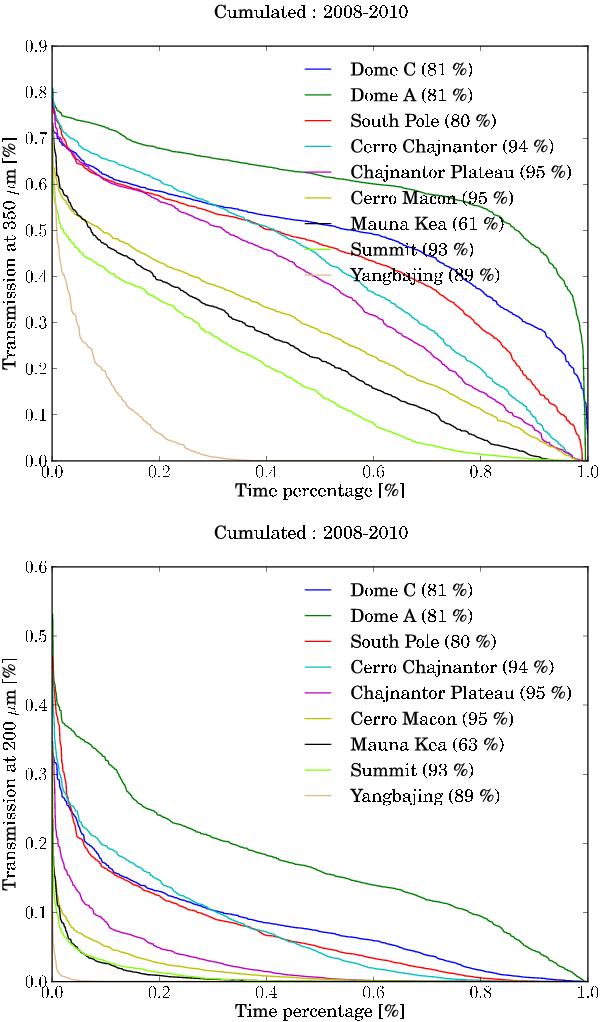
Comparison of the distribution functions of the 350-μm (top) and 200-μm (bottom) transmissions for all the sites between 2008 and 2010. The x-axis time percentage is done over the period during which the data extraction for the sites was possible, the actual percentage of data we got is indicated for each site in parenthesis.
Current usage metrics show cumulative count of Article Views (full-text article views including HTML views, PDF and ePub downloads, according to the available data) and Abstracts Views on Vision4Press platform.
Data correspond to usage on the plateform after 2015. The current usage metrics is available 48-96 hours after online publication and is updated daily on week days.
Initial download of the metrics may take a while.