Fig. 4
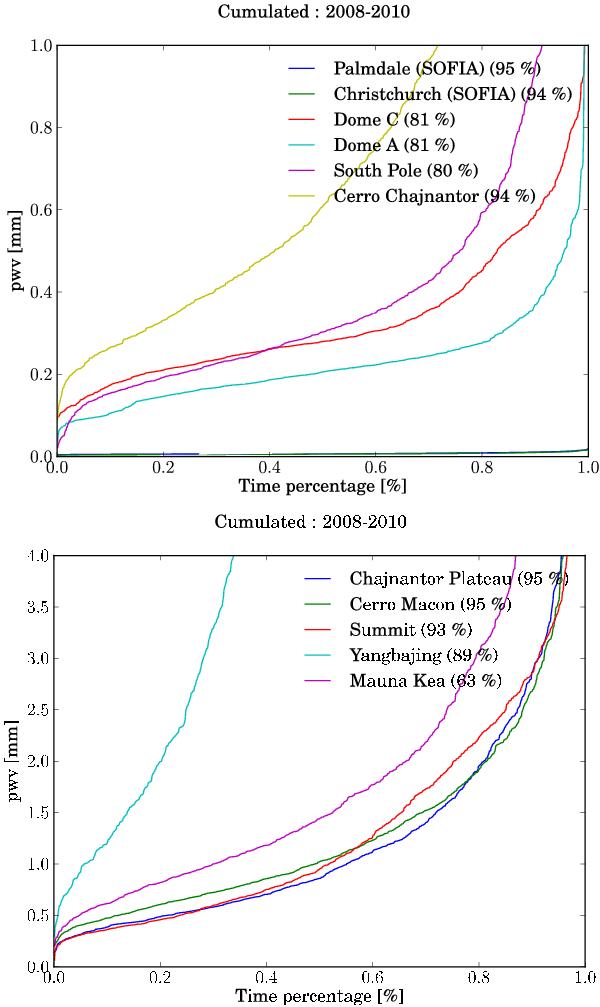
Comparison of the distribution functions of the PWV for all sites between 2008 and 2010. The percentage of days over this period on which we achieved the data extraction is indicated in parenthesis. The time percentage (x-axis) is taken over the total number of days on which we achieved the data extraction. In the upper panel, the curves for Palmdale (dark blue) and Christchurch (green) are blended and very close to the 0.0 mm level.
Current usage metrics show cumulative count of Article Views (full-text article views including HTML views, PDF and ePub downloads, according to the available data) and Abstracts Views on Vision4Press platform.
Data correspond to usage on the plateform after 2015. The current usage metrics is available 48-96 hours after online publication and is updated daily on week days.
Initial download of the metrics may take a while.