Free Access
Fig. 2
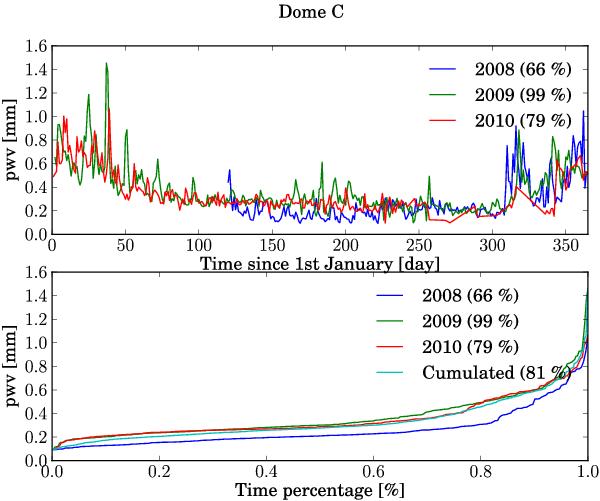
Top: PWV content measured at Dome C, Antarctica over the French-Italian base Concordia between 2008 and 2010. The percentage indicates the fraction of days in the year when we were able to extract the data from the satellite measurements. Bottom: distribution function of the PWV for each year and for the whole period.
Current usage metrics show cumulative count of Article Views (full-text article views including HTML views, PDF and ePub downloads, according to the available data) and Abstracts Views on Vision4Press platform.
Data correspond to usage on the plateform after 2015. The current usage metrics is available 48-96 hours after online publication and is updated daily on week days.
Initial download of the metrics may take a while.