Free Access
Fig. 4
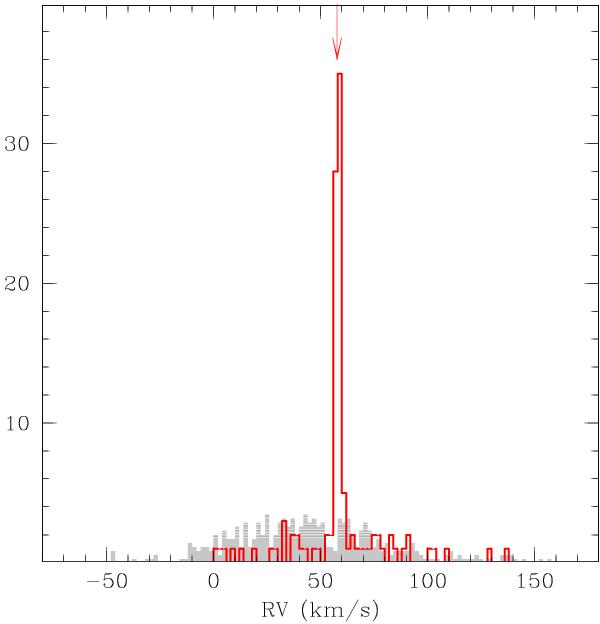
Histogram of all RVs for the FLAMES spectra (red, open histogram) and for the Besançon model (Robin et al. 2003) in the direction of Be 39, on the same area of the Kassis et al. (1997) data and normalised to the number of our stars (filled, grey histogram).
Current usage metrics show cumulative count of Article Views (full-text article views including HTML views, PDF and ePub downloads, according to the available data) and Abstracts Views on Vision4Press platform.
Data correspond to usage on the plateform after 2015. The current usage metrics is available 48-96 hours after online publication and is updated daily on week days.
Initial download of the metrics may take a while.