Fig. 3
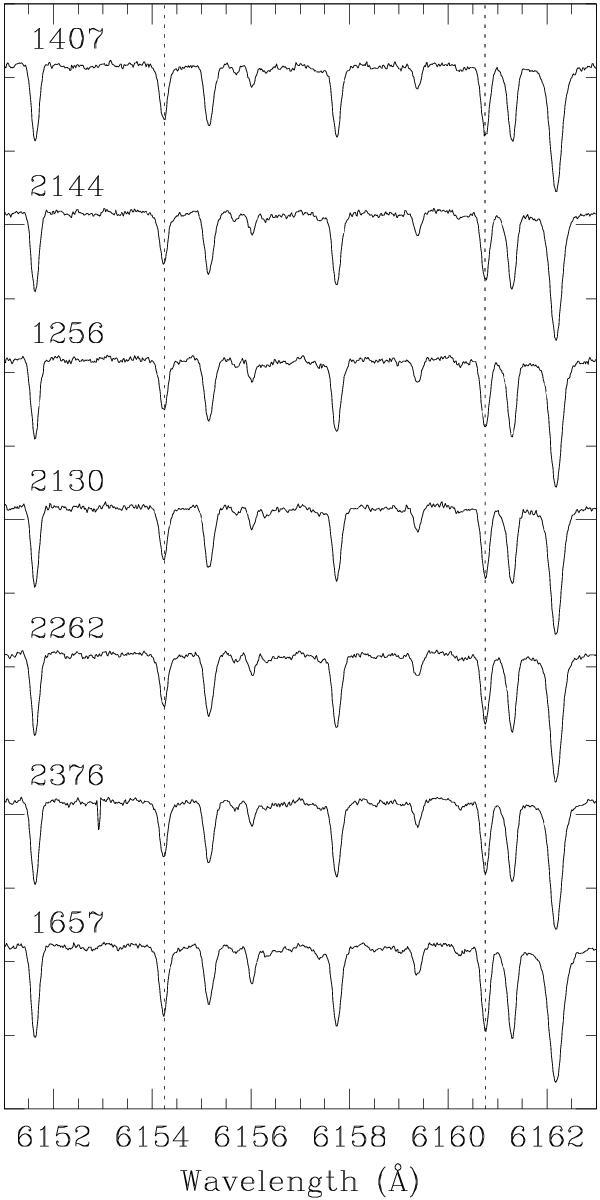
Portion of the UVES spectra in the Na i lines region; the two Na lines are indicated by the dotted lines. The normalised spectra are offset for clarity and are plotted in order of decreasing Teff, with the RGB star at the bottom. The Na and all other lines are practically identical in all stars, with only a small difference between the RGB and the RC ones.
Current usage metrics show cumulative count of Article Views (full-text article views including HTML views, PDF and ePub downloads, according to the available data) and Abstracts Views on Vision4Press platform.
Data correspond to usage on the plateform after 2015. The current usage metrics is available 48-96 hours after online publication and is updated daily on week days.
Initial download of the metrics may take a while.