Fig. 8
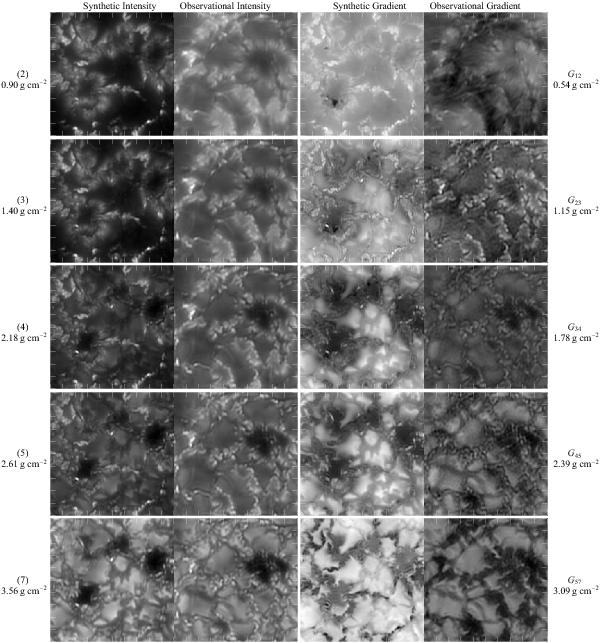
An active patch with pores and ribbons of bright points (the pore region close to the vertex of the sunspot in Fig. 1) compared with the synthetic images from the 3D MHD simulation snapshot from Lagerfjärd & Nordlund (in prep.). From left to right: intensity from synthetics, intensity from observations, gradient maps from synthetics and gradient maps from observations. The depths in terms of column mass shown on the left side are the average depth from all the pixels when computed as in Sect. 4.2. Each tick-mark corresponds to one arcsec. Each pair of synthetic and observational images are scaled in the same way.
Current usage metrics show cumulative count of Article Views (full-text article views including HTML views, PDF and ePub downloads, according to the available data) and Abstracts Views on Vision4Press platform.
Data correspond to usage on the plateform after 2015. The current usage metrics is available 48-96 hours after online publication and is updated daily on week days.
Initial download of the metrics may take a while.