Fig. 5
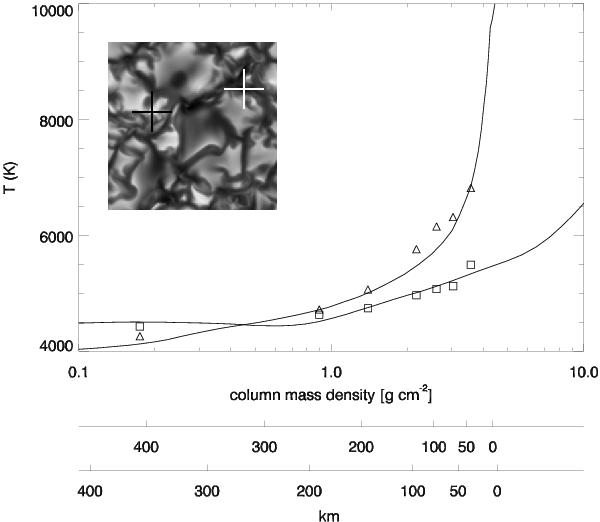
Temperature stratification for two columns, extracted from the synthetic images, are shown. The solid lines are the respective known temperature stratifications from the 3D HD simulated atmosphere. The dark crosshair marks the brightest near-continuum pixel and corresponds to the upper set of points, upper line, and the upper geometrical height scale. The white crosshair marks the darkest pixel and corresponds to the bottom set of points, bottom line, and bottom geometrical height scale, with zero defined by the mean optical depth ⟨lgτ500⟩ = 1.
Current usage metrics show cumulative count of Article Views (full-text article views including HTML views, PDF and ePub downloads, according to the available data) and Abstracts Views on Vision4Press platform.
Data correspond to usage on the plateform after 2015. The current usage metrics is available 48-96 hours after online publication and is updated daily on week days.
Initial download of the metrics may take a while.